Welcome to gslides’s documentation!
gslides: Creating charts in Google slides
gslides is a Python package that helps analysts turn pandas dataframes into Google slides & sheets charts by configuring and executing Google API calls.
The package provides a set of classes that enable the user full control over the creation of new visualizations through configurable parameters while eliminating the complexity of working directly with the Google API.
Quick Installation
pip install gslides
Usage
Below is an example that only showcases a simple workflow. Full discussion around features can be found in the docs.
1. Initialize package and connection
import gslides
from gslides import (
    Frame,
    Presentation,
    Spreadsheet,
    Table,
    Series, Chart
)
from sklearn import datasets
gslides.initialize_credentials(creds) #BringYourOwnCredentials
2. Create a presentation
prs = Presentation.create(name = 'demo pres')
3. Create a spreadsheet
spr = Spreadsheet.create(
    title = 'demo spreadsheet',
    sheet_names = ['demo sheet']
)
4. Load the data to the spreadsheet
plt_df = #Iris data
frame = Frame.create(df = plt_df,
          spreadsheet_id = spr.spreadsheet_id,
          sheet_id = spr.sheet_names['demo sheet'],
          sheet_name = 'demo sheet',
          overwrite_data = True
)
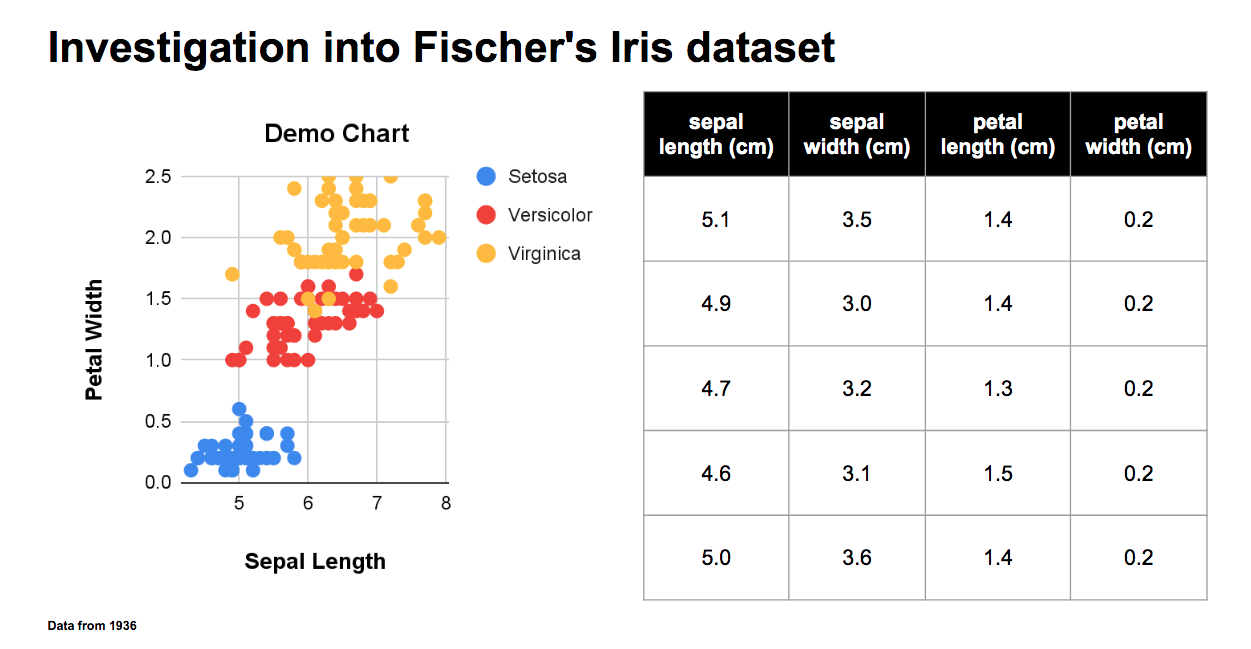
5. Create a scatterplot
sc = Series.scatter(series_columns = target_names)
ch = Chart(
    data = frame.data,
    x_axis_column = 'sepal length (cm)',
    series = [sc],
    title = f'Demo Chart',
    x_axis_label = 'Sepal Length',
    y_axis_label = 'Petal Width',
    legend_position = 'RIGHT_LEGEND',
)
6. Create a table
tbl = Table(
    data = plt_df.head()
)
7. Create a slide with the scatterplot
prs.add_slide(
  objects = [ch, tbl],
  layout = (1,2),
  title = "Investigation into Fischer's Iris dataset",
  notes = "Data from 1936"
)
8. Preview the slide you have just created in your notebook
prs.show_slide(prs.slide_ids[-1])

gslides also supports basic templating functionality. See this notebook for an example.
Advanced Usage
Find this Jupyter notebook detailing advanced usage of gslides.
Developer Instructions
To install the package with development dependencies run the command
pip install -e .[dev]
This will enable the following
Unit testing using pytest - Run
pytestin root package directorySphinx documentation - To create sphinx run
make htmlin package docs folder - To view locally runpython -m http.server